Okay. Last time, we covered what ROI is (financial outcomes) and what it isn’t (non-financial outcomes). We also went over where financial outcomes are measured vs. where non-financial outcomes are measured. In previous posts, we also established that the process involved in tying financial outcomes (the R/Return in ROI) to the initial investment (the I/Investment in ROI) takes more time and work than simply creating a spreadsheet or magical ROI Calculator. Now, let’s take our ROI methodology discussion to the next chapter: Timelines.
Today’s post won’t blow your mind or anything. It’s actually VERY simple. Almost too simple. And I hate to insult your intelligence, but bear with me. I don’t want to skip any steps, and this one is one of the most fundamental building blocks of the general methodology we are going to cover, so as simple as it may seem, it is crucial that everyone understand it clearly before we move on. (Look at the bright side: This post will be short and sweet for once.) And I am even going to share some pretty important notes that will save you LOTS of time and effort when you build a measurement practice. (If I didn’t share these with you, you would curse my name in about six months when you realize you should have done a few extra little things on the front end.) More on that in a few paragraphs.
Check out this quick video, and we’ll cover the meat of this chapter in about three minutes:
I know you guys are probably used to measuring outcomes based on calendar cycles, right? You have your start date, then you have your weekly reviews, then your monthly reviews, quarterly maybe, even by Half. I’ve seen programs and campaigns measure outcomes annually as well. Typically, these measurement milestones are scheduled to coincide with meetings and reports coming due for the client or the boss, right? Right.
If you’re used to that type of schedule, this won’t be too far of a stretch. It’s a little different, sure, and requires a little more diligence, but anyone can do this. (Heck, you can even assign the task of creating and managing action timelines to a team of interns. Bonus: It will teach them a lot about how businesses manage their resources and their time in a linear way.)
What you are going to start doing (assuming you don’t already do this – and my hunch is that you aren’t doing it) is simply this: You are going to create and manage a timeline of every significant activity visible to the public done by your company. Here’s how it works: First, create a blank timeline. (You can use any number of tools to do this. Excel works well for most, but feel free to use whatever works for you.) Figure 1:

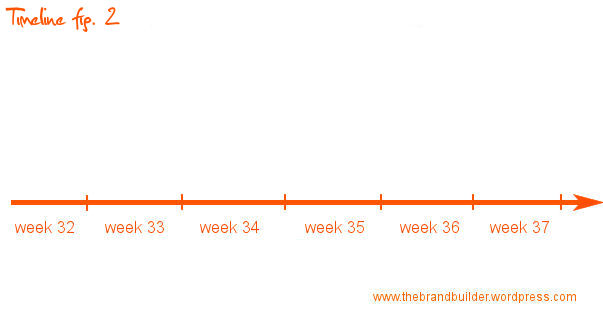
Step 2: Divide your timeline into quarters, months, weeks and days. If you are planning on truly measuring real-time impact of your social media activities, go ahead and add hours to the mix. It’s okay if you don’t yet, but chances are that your timelines will become that specific at some point. (Even more so since some web and social media monitoring tools already give you the ability to monitor impact in web traffic, social mentions and other metrics into 10-minute increments.) For the sake of simplicity though, we’ll stick to months, weeks and days in our example. Figure 2:

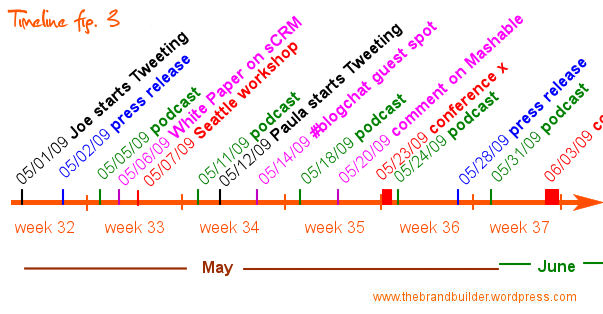
Once you have your timeline neatly organized and divided into time packets, you can start adding your milestones. These are individual activities you want to plot along this timeline. Press releases going out. Trade shows. New product launches. Blog posts. Podcasts. Workshops. Presentations to business organizations. Employees launching twitter accounts or blogs. New blog posts. Ad campaigns. Publishing e-books or white papers. Anything that the public is going to see, go ahead and plot. (As you can see, your timeline is going to get crowdedvery fast, so make sure to make it extensible.)

This will require a pretty constant level of communication with PR, Marketing, advertising, sales, business development, investor relations, IT, sales, etc. What you are doing is creating a time-stamped inventory of a lot of activities touched by potentially dozens of people and departments throughout your organization, so it’s best to start getting organized.
Note 1: Each of these activities should come with its own little info packet. Depending on the tool(s) you are using to plot this timeline, you can make each activity searchable and easy to reference. Ideally, you want to keep a detailed file on every single activity. This file should include content, source, destination, channels, cost, notes, etc. You can tie the file to urls, CRM, project folders housed online or on a server, etc. Thorough is good. If one of these activities turns out to be a huge success, you will want to be able to go back and see what you did right, who was involved, etc. (Conversely, if the activity was a monumental flop, you will also want to know where you went wrong.)
Note 2: One of the elements of each info packet should be cost: How much did each activity cost? Why? Because that’s the “I” in R.O.I.: Investment. You want to be able to tie a cost (investment) to each activity. This information will come in handy when you start tying financial outcomes to activities that got you there. (Do it now, as you plot each activity. Don’t wait until the night before your R.O.I. review/report is due.) If you don’t know what a press release or blog post costs you, find out. (You can’t measure return on investment if you have no idea what your investment is.)
Note 3: Assign categories to each type of activity. Color-coding is nice, but if you are using Excel, think about adding a little line of code for specific categories. This will help you create macros for your ROI analysis later. (Instead of just looking at the ROI of specific activities, you will also be able to batch them. Examples: PR, Blog, Twitter, Trade show, John Smith, Advertising, YouTube videos, Podcast, etc. This will give you a richer analysis of what types of efforts are working well vs. not so well. You will also be able to identify and confirm seasonal cycles – assuming there are some. It would be unfortunate not to have access to that level of analysis, so make sure you don’t forget to do this.
Tomorrow, we start looking at how your activity timeline, overlaid with social media monitoring and other media measurement tools will help you connect the dots between activities and outcomes, and eventually tie financial return to individual investment in specific activities (and types of activities). Simple right? In theory yes. But it takes work and some tech savvy (remember the category tags and information packets?). I told you this would be a little bit more involved than plugging numbers into an ROI calculator, didn’t I.

Great rundown on timelines, Olivier. I think one thing some people (even I) don’t realize sometimes is that there is a lot more pre-planning and organization that goes on when setting up a system to calculate ROI.
This was definitely helpful and something I’ll be implementing myself.
not much know about this. this is a new info for me but i very enjoy to read your article
keep sharing my friend 🙂
Another thing that unfunded/bootstrapping start-ups should track is hours that they worked on it (unpaid). It might be useful in determining whether your time was worthwhile or could be better served else where.
Great stuff. I think there is a tendency to only look at actions and resulting ROI shortly after they occur. It is much better to plot everything like this so you can take more of a wider view and look at things 6 months after, 1 year after, etc. This is very helpful. Now I just need to figure out the best way to set this up to be easily updated/sorted/searchable.
That’s part of the fun. (Easier said than done.) Getting everyone in your org onboard helps. It works great when all departments have a central place to upload the data and have it in their procedures that it must be done daily. 🙂
Good stuff. For most of us, especially those with direct response experience, tracking the impact of individual activities is second nature. Taking a whole view is a different matter, especially when it involves crossing silos and engaging multiple functions. Integrating marketing communications is something everyone likes to talk about. But the operational and cultural barriers can be daunting, especially in larger organizations.
This is leading me to a question about using external inputs (offline activities are the most obvious example) to justify return on social media investment. But I’ll hold off for now.
By the way, making the data points on your timeline rich enough to permit cross-tabbed analysis is a fantastic idea. I’m having trouble wrapping my brain around how to pull it off. Probably a good idea to buy lunch for the IT folks once in awhile.
Haha. There you go. The IT peeps love a good challenge. Getting them onboard shouldn’t be too hard, and it’s good to have them on your side.
This is all new to me! I’m just getting into helping clients out with social media strategy and this is just what I need to help them track implementation and return. Thanks for this!
You’re welcome. All easier said than done though. If you guys run into a snag, let me know.
I like this idea – we already keep a calendar – It would be easy to flip into a timeline. You used excel for this? Any tips or a template you’d care to share? Thanks Olivier!
Exactly! Same thing. 🙂
Olivier,
Great concept! I am having trouble figuring out what tools/software would be best at creating these types of timelines. Do you have any suggestions?
One of the most universally available tools that can graph this for you is Excel, actually. Lots of work on the front end, but if everyone is disciplined about entering the activities they are responsible for, it isn’t all that bad. Just set up the format, assign some protocols, host it all on a sharepoint server, and voila. You can also use Microsoft Project to create a more operationally rich folder, but since nobody really uses Project, that may overcomplicate things.
What’s key here is to use a tool that everyone has access to and is familiar with. If you don’t do this, you end up forcing one or two people to be responsible for all of the data entry, and that can become overwhelming. Simple works.
Hi! I just want to give you a huge thumbs up for your great info you have right here on this post. I am coming back to your site for more soon.